

A Single Quarter, $112 billion.
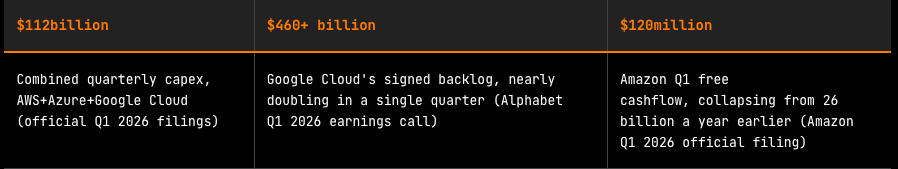
The three hyperscalers burned through $112 billion in capex in Q1 2026. Has your board asked which side you’re on yet?

The three hyperscalers burned through $112 billion in capex in Q1 2026. My partner and I stared at the same set of earnings releases and argued for nearly an hour. What follows is a transcript of that conversation.
When the earnings calls ended, I opened a spreadsheet. My partner sat beside me, fixed his eyes on the same number, and said, “Don’t you find this free-cash-flow figure deeply problematic?” I said, “I think you’re reading the wrong number.”
Then we argued for the better part of an hour.
Below is that conversation. Every number comes directly from the official Q1 2026 filings. Neither side’s argument has been sanitized.
CIO / The Offensive
You know what Pichai said on the call — “We can take in more money than we can build.” That isn’t PR. It’s a direct description of a supply-demand imbalance.
I’m not looking at free cash flow. I’m looking at revenue acceleration. You’re running depreciation through the cost line; I’m running this through the demand line:
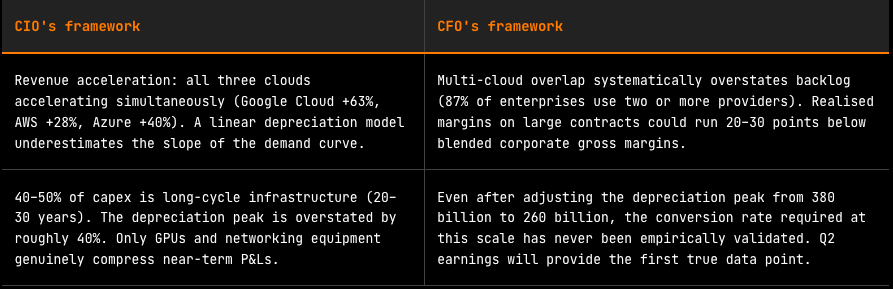
• Google Cloud Q1 YoY growth: +63% (Q4 2025 was +30%) → accelerated by 33 percentage points
• AWS Q1 YoY: +28% (Q4 2025 was +19%) → accelerated by 9 percentage points
• Azure Q1 YoY: +40% (AI contribution of 16 points vs. zero a year ago)
• Backlog: from $240 billion to $460 billion — a single-quarter net increase of $220 billion
Sources: Company Q1 2026 filings, April 29–30, 2026
Your depreciation model assumes revenue is linear. But when all three are accelerating simultaneously, the linear assumption itself is wrong. I’m using acceleration, not velocity. The demand is already on the table. The problem is that the hardware can’t be built fast enough.
CFO / The Defensive
Hold on. That Microsoft RPO figure you cited — $627 billion — includes Office 365, Dynamics, LinkedIn. It isn’t pure Azure. Comparing it directly to AWS backlog is a mistake. That’s the biggest hole in your entire argument.
Now let me talk about free cash flow. Amazon’s FCF collapsed from $26 billion a year ago to $120 million this quarter (BofA Global Research recap, April 30, 2026). Capex of $43.2 billion consumed virtually all operating cash flow. A Barclays note the same week estimates Microsoft’s FCF will fall 28% this year; Meta’s full-year decline approaches 90% (Barclays Research, April 30, 2026).
But what I am really calculating is the depreciation peak in 2027–2028:
2026 capex: $725 billion ÷ 5 years = annual depreciation of $145 billion (first year)
2027 consensus capex estimate: $1 trillion+ ÷ 5 years = another $200 billion+ per year
2028 peak depreciation: combined annual depreciation pressure of $320–380 billion, roughly 2.6× the full-year 2025 figure
Pleroma Capital estimates, based on Evercore / BofA consensus capex forecasts (April 30, 2026); five-year straight-line amortization, excluding financing costs
What speed of revenue growth is supposed to absorb that number?
Note: Microsoft’s commercial RPO of $627 billion includes Azure, Office 365, Dynamics, and LinkedIn. The pure-cloud portion is not separately disclosed and cannot be summed directly with AWS or Google Cloud pure-cloud backlog.
CIO / The Offensive
You’re right on the RPO point — I accept that. But you’re treating depreciation as an income-statement problem; I’m treating it as a pricing-power problem. The two frameworks lead to opposite conclusions.
Once an enterprise has wired in AI inference, the switching cost isn’t a technical issue — it’s an organizational one, a compliance one, a retraining-engineers one. I’ve run the unit economics on a $1 billion-plus multi-year contract:
Assume a 36-month contract term and a 70% gross margin (close to what Google Cloud disclosed in Q1 2026)
A single $1 billion contract generates $700 million in gross profit over 36 months
The gross margin earned over the contract’s life is roughly 2.1× the allocated capex depreciation cost
Pichai said they have “dozens” of $1 billion-plus contracts in negotiation right now
Pleroma Capital estimate, based on Alphabet Q1 2026 earnings call gross margin disclosures and contract-size commentary
“You are calculating aggregate depreciation peaks. I am calculating payback periods on individual contracts. We are not having the same argument.” — CFO
CFO / The Defensive
I don’t dispute customer stickiness. But here’s a question you haven’t answered: how much of this backlog represents the same enterprise signing separate commitments with AWS, Azure, and Google Cloud? Gartner’s multi-cloud adoption survey shows more than 87% of enterprises use two or more cloud providers (Gartner, 2025). Adding the three together systematically overstates the digestible total.
And then there’s this: the GPU technology cycle runs roughly 18 months per generation. If the next generation of compute, arriving in 2028, is 60% cheaper, won’t customers have every incentive to renegotiate? Nobody is applying a discount for that technology-substitution risk in their backlog analysis. Alphabet doesn’t disclose the proportion of contracts with flexibility clauses; AWS doesn’t either. I can’t get that number. That is the problem.
I’m not arguing against investing. I’m arguing for a conversion assumption more precise than “the backlog is huge,” so I can tell the board the hurdle rate is justified with a straight face. I’ve just raised the hurdle rate on any investment with an NPV beyond five years from 8% to 11% — for one reason: the market is no longer compensating you for the uncertainty you’re absorbing.
CIO / The Offensive
The tech-substitution point is good, but you’re misclassifying the asset life. Server halls, power infrastructure, cooling systems — those depreciate over 20 to 30 years, not five. You’re running five-year depreciation on GPUs, not on the whole data center.
The framework I use is infrastructure return, not single-cycle P&L:
• Physical data centre infrastructure (power, cooling, land, buildings) represents roughly 40–50% of hyperscaler capex
• Combined total of $725 billion × 45% = $326 billion falls into long-cycle assets (20–30-year amortisation)
• The portion that genuinely hits the income statement within five years is the remaining $399 billion (GPUs + networking equipment)
• Your depreciation peak calculation is overstated by about 40%
Pleroma Capital breakdown, based on AWS 2020–2025 annual report asset composition and industry data-centre construction cost ratios
The fibre-optic bubble was a case of demand not showing up. This time, demand is exceeding supply, and the next generation of GPUs requires more power and more cooling, not less. The physical foundation you build today is still needed by the next generation of hardware.
CFO / The Defensive
I accept your asset breakdown — applying five-year depreciation to long-cycle infrastructure does overstate the pressure. That adjustment brings my depreciation-peak number down from roughly $380 billion to around $260 billion.
But it doesn’t change my core problem. Your $1 billion contract economics rely on one assumption I have to challenge: the 70% gross margin is the overall Google Cloud figure, not the margin on newly signed mega-deals. Large contracts typically carry discounts. Hyperscalers compress price to capture share — the realised margin on those deals is likely well below the blended level disclosed in earnings. How big the gap is, nobody knows, because nobody has broken it out.
• Your model: $1 billion contract × 70% = $700 million contribution
• My stress-tested assumption: apply a 30% discount to the gross margin → 49%
• Same contract, contribution drops from $700 million to $490 million, a difference of $210 million
• If “dozens” means 30 contracts, the aggregate impact exceeds $60 billion
Pleroma Capital stress test; large-contract discount assumption based on SaaS industry norms, not official figures
The Q2 earnings release is the first opportunity for large-scale disclosure. Until that number arrives, my trigger conditions don’t move, and the position doesn’t move. I’m not waiting on the share price. I’m waiting on the fundamentals. The Q2 earnings release is the first opportunity for large-scale disclosure. Until that number arrives, my trigger conditions don’t move. I’m not waiting on the share price. I’m waiting on the fundamentals.
The real tension in this debate
How, exactly, does the CFO calculate the conversion assumption?
What decision did Pleroma Capital actually make?
The following content contains the tools we use in our own capital-allocation decisions for paid subscribers.
The Backlog Conversion Model: a three-variable formula with worked examples for AWS and Google Cloud
The Depreciation Cliff Timeline: 2026–2030 depreciation pressure vs. revenue guidance for all three clouds