


Our reader Warren L. asked a question. The answer came out backwards. The cliff wasn't removed—the One Big Beautiful Bill duplicated it, and the copy is taller than my original estimate.
We are happy to elaborate on any topic our subscribers are interested in. Warren was the first one echoing our CFO’s previous piece, so here it is.
On May 20th, Nvidia delivered what may be the strongest quarterly earnings report in semiconductor history. The stock barely moved. I’ll come back to that silence — because there is something more unsettling I need to address first.
On May 12th, I flagged Warren Lee’s comment and added it to my closing list. His question: “Did you account for the 100% bonus depreciation under the One Big Beautiful Bill?”
I hadn’t. I assumed adding it would make the numbers look better. The opposite turned out to be true.
The $120M: What This Number Actually Is
Let me establish what this figure represents. The $120M is not a market-consensus figure. It is a trailing twelve-month free cash flow number I derived directly from Amazon’s Q1 2026 10-Q cash flow statement — not a figure anyone is citing. With the OBBBA tax shield in place, Amazon’s free cash flow has compressed to $120M. Strip the shield out and it falls to negative $19.3B.
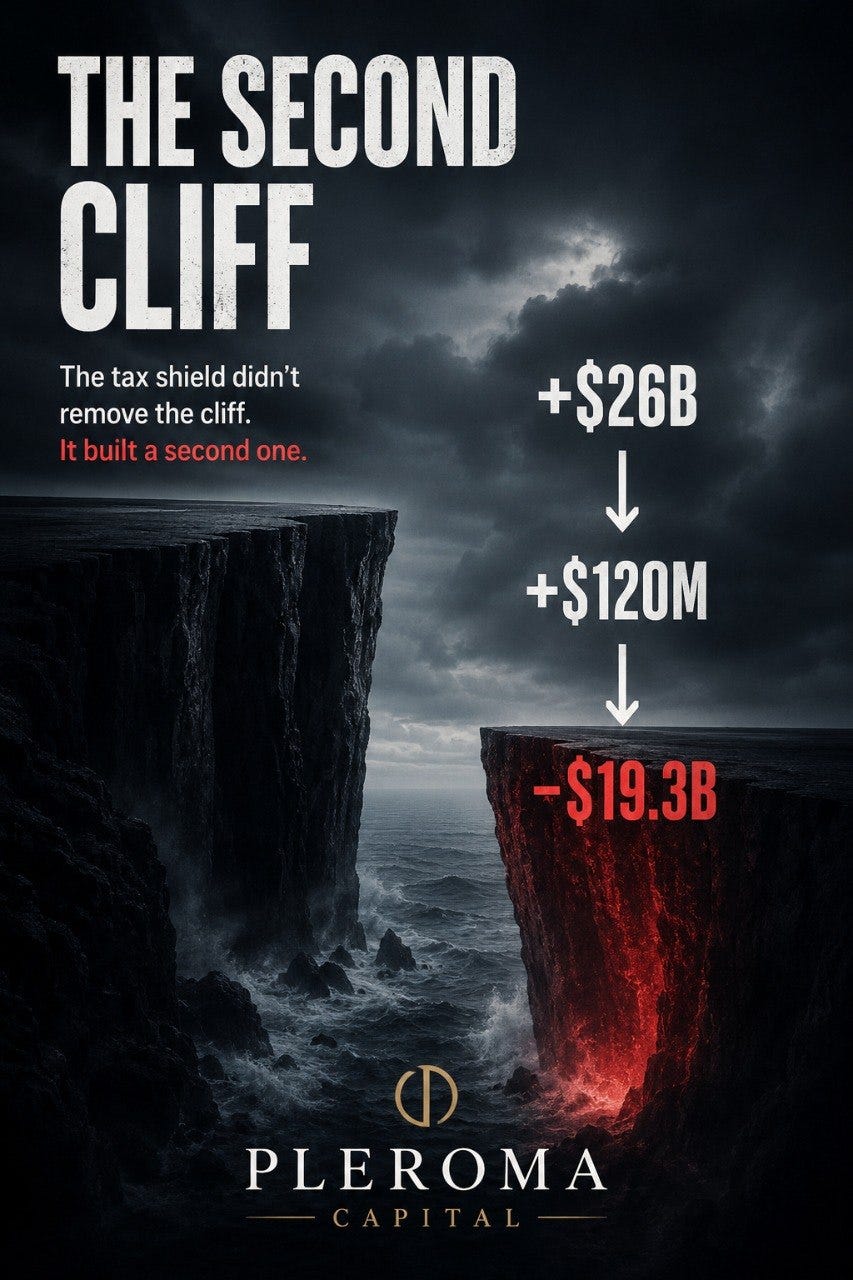
Three numbers, side by side: +$26B → $120M → −$19.3B. The tax shield is the only thing holding the middle figure above zero. A year ago, TTM free cash flow stood at +$26B (BofA Global Research recap, April 30, 2026).
The Tax Law: Getting the Facts Straight
The One Big Beautiful Bill (Public Law 119-21) was signed on July 4, 2025. Its central provision: 100% bonus depreciation — full immediate expensing — applies to commercial assets placed in service after January 19, 2025, on a permanent basis with no sunset clause. The IRS issued Notice 2026-11 in January 2026 providing implementation guidance.
The implication: Amazon’s entire Q1 2026 capital expenditure (gross $44.2B, net $43.2B; Amazon Q1 2026 10-Q, March 31, 2026) can be expensed in full in the 2026 tax year, in a single period.
The OBBBA’s effect doesn’t require modeling. It is written directly into the financial statements.
Working through Amazon’s Q1 2026 10-Q cash flow statement surfaces the relevant line. A brief technical point: deferred income taxes appear as a positive add-back on the cash flow statement — meaning GAAP tax expense exceeded actual cash taxes paid in the period, with the shortfall deferred to future years. OBBBA allowed Amazon to deduct the full capital expenditure for tax purposes immediately, compressing current-period cash taxes and accumulating the differential in this line:

Year-over-year increase: +$12,291M (approximately +$12.3B). In Q1 2025 — before OBBBA’s enactment — this line carried only $507M. By Q1 2026 it had jumped to $12,798M, with the $12.3B increase almost entirely attributable to OBBBA.
There is, however, a gap that has to be closed before the conclusion stands.
Amazon’s Q1 2026 income statement includes $15,982M in non-operating income (Q1 2025: $3,274M), of which $15,632M is reversed on the cash flow statement as a non-cash item. This reflects primarily unrealized gains on equity investments — recognized under GAAP but not taxable until realized, and generating their own deferred tax liability that must be separated out before the remainder can be attributed to OBBBA.
Applying the effective tax rate of 24% ($9,560M ÷ $39,834M; Amazon Q1 2026 10-Q) yields an estimated deferred tax contribution from investment gains of approximately $3,752M. (This is a Pleroma Capital upper-bound estimate; Amazon does not disaggregate deferred tax by source in its filing.) Applying the same methodology to Q1 2025, the OBBBA-attributable increment for Q1 2026 works out to $9.2B—not the unadjusted $12.3B, and not my original estimate of $1.82B:
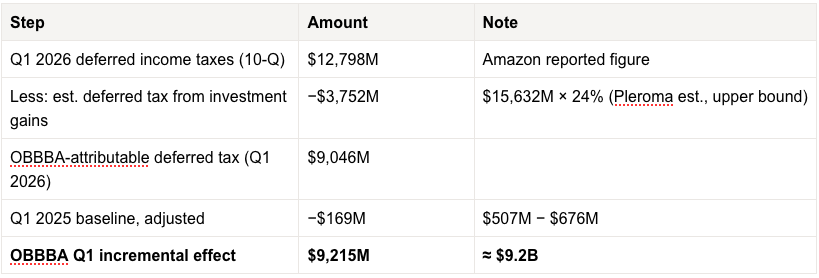
In plain terms: deduct the deferred tax that investment gains generated independently, and what remains is the tax OBBBA actually deferred. That is the number that matters.
Applying the same attribution logic to the trailing twelve-month period (deducting an estimated $7,496M swing attributable to non-cash investment items), the OBBBA-specific TTM swing comes to approximately $19.5B.
With the tax shield: Amazon TTM free cash flow = $120M. Without it: −$19.3B.
That is not the answer I wanted to give Warren Lee.
“OBBBA lets you pay less tax this year and more in 2028. It didn’t move the cliff — it built a second one.”
The $120M in free cash flow exists because the tax shield is holding the number above zero. The legislation did not make the problem disappear. It gave the problem a few more lines on the income statement before it resurfaces.
The Second Cliff: What I Missed on May 12th
This is what Warren Lee’s question actually exposed.
100% bonus depreciation has allowed hyperscalers to pull forward — in bulk — the tax deductions that would otherwise have been spread across future years. The accounting consequence is a growing deferred tax liability. As these assets continue depreciating on the GAAP books over five years, there will be no matching tax deduction available: it was all consumed in 2025 and 2026.
The result: from 2028 through 2031, taxable income at these companies will persistently exceed GAAP earnings, requiring materially higher cash tax payments.
No estimates needed. The number is already in the 10-Q: Amazon’s TTM deferred tax accumulation through Q1 2026 stands at +$23,761M (Amazon Q1 2026 10-Q, March 31, 2026).
When I saw that figure, I stopped. This is not a projection. It is already sitting on the balance sheet — a floor on what will eventually have to be settled in cash.
With full-year capex running at an annualized $175-180B (based on Q1’s $44.2B), this figure will continue climbing through year-end. Annualized second-cliff exposure (Pleroma Capital estimate, based on 10-Q figures):
Amortizing the $23,761M TTM accumulation over five years implies approximately $4.75B per year in reversals. If full-year 2026 additions match a similar order of magnitude, total deferred tax liability could exceed $50B. Combined incremental annual cash tax burden (2028-2031): estimated $8-12B per year (Pleroma Capital, pending full-year filings).
My original second-cliff estimate on May 12th was $2.94B per year. The actual 10-Q data suggests that figure was understated by at least 60%.
A counterargument deserves direct engagement: OBBBA is permanent legislation. If hyperscalers continue investing at comparable scale in 2027, new asset acquisitions will again qualify for full expensing, generating fresh deferred tax liabilities that partially offset the reversal of older ones. The second cliff may prove less abrupt than a static model implies.
That argument is valid — but conditional. It holds only if capex growth is sustained. The moment year-on-year growth decelerates from 50% to 10%, the self-hedging mechanism breaks down and accumulated old deferred taxes begin net-reversing into higher cash taxes. That is precisely the 2028-2030 scenario this analysis is constructing: the Blackwell procurement wave will have peaked; the next cycle of investment commitments is not yet confirmed. (Or the macro / geopolitical outlook)
One figure I should not leave unaddressed: deferring $95B in combined tax payments (estimated shield across the three companies) by an average of three years, at an 8% cost of capital, produces an NPV benefit of approximately $19.6B ($95B × (1 − 1/1.08³)). That is a real economic gain. Ignoring it would be intellectually dishonest. But it purchases time, not relief. The cash is still owed. Whether liquidity holds at a specific future date is a different question from whether the NPV is positive — and CFOs are paid to answer both.
What This Means for the CFO and the CIO
For the CFO, the operative question is whether liquidity holds at a specific point in 2028 — not at some vague future date. Peak depreciation compresses GAAP earnings. Deferred tax reversal increases cash outflows. Long-end rates above 4.5% raise refinancing costs. All three pressures land within the same window. This is not diffuse future risk. It is a risk with a known trigger date, which means liquidity buffers can be calibrated and positioned now — provided you know the date is coming.
For the CIO, the issue is a pricing gap. Markets are pricing the hyperscaler capex narrative. Nobody is pricing the second tax cliff. That asymmetry — between what is known and what is priced — is one of the most ridiculous mispricings I can currently identify, and it will persist until Q2 backlog conversion data forces a reassessment.
A note for Asia-based allocators: this has a specific additional dimension for those managing capital out of Singapore, Hong Kong, or Tokyo. Family offices and institutional allocators across the region typically built their US mega-cap technology exposure during the 2022-2023 valuation correction. Those positions look sound at current cost. But the 2028 dual-pressure window coincides with a period when the Fed may still be managing inflation, keeping long-end rates elevated. Asia-based holders of dollar-denominated technology assets face three simultaneous vectors: GAAP earnings compressed by peak depreciation, free cash flow deterioration from tax reversal, and FX drag if the dollar weakens under market stress. The mathematical overlap of those three pressures in the same window is not comfortable. In every risk committee discussion I have sat through, I have never seen OBBBA’s deferred tax reversal appear in a 2028 stress scenario. Not because it is unimportant, but because tax code provisions do not always make it onto the portfolio manager’s standard reading list. Putting it there is part of the purpose of this piece.
Nvidia’s Earnings Handed Me an Unexpected Ratio
One number in Nvidia’s May 20th report made me reach for the calculator a second time. Nvidia’s Q1 FY2027 data center revenue attributable to hyperscaler customers represented approximately 50% of the total, or roughly $37.9B (Nvidia Q1 FY2027 8-K, May 20, 2026).
$37.9B ÷ $112B (combined Q1 2026 capex across the three major hyperscalers) = 33.8%.
A methodological note: this ratio carries two limitations. Nvidia’s definition of “hyperscaler” may not map precisely onto AWS, Google Cloud, and Azure alone. And Nvidia’s Q1 FY2027 closing date (April 2026) does not align exactly with the three hyperscalers’ Q1 2026 reporting periods. The 33.8% is a reasonable proxy, not a clean correspondence.
The directional conclusion is clear: for every dollar of hyperscaler capital expenditure, only $0.34 flows to Nvidia GPUs. The remaining $0.66 flows to custom silicon (Google TPUs, AWS Trainium, Microsoft Maia), networking infrastructure (InfiniBand, Spectrum-X — Nvidia’s own filing shows this segment up 199% year-over-year), and power, cooling, land, and buildings.
Before drawing the depreciation implication, I need to resolve the apparent inconsistency between two figures in this piece: 33.8% and 67%, a difference of nearly two-to-one.
The 33.8% measures Nvidia’s vendor share — how much of this capex Nvidia captured as revenue. TPUs, Trainium, and Maia are excluded from Nvidia’s revenue line, but they are short-lived assets and fully eligible under OBBBA. The 67% is Microsoft’s own disclosure: two-thirds of its capex is short-lived, across all vendors and all chip brands. The depreciation model uses 67%, not 33.8% — because OBBBA attaches to the asset, not the manufacturer. The 33.8% makes a different point: even at the peak of the AI investment cycle, Nvidia captured only one-third of the spend. The rest flowed to alternatives and competitors. That is a separate question from where the depreciation peak lands.
With the revised short-lived asset assumption applied:
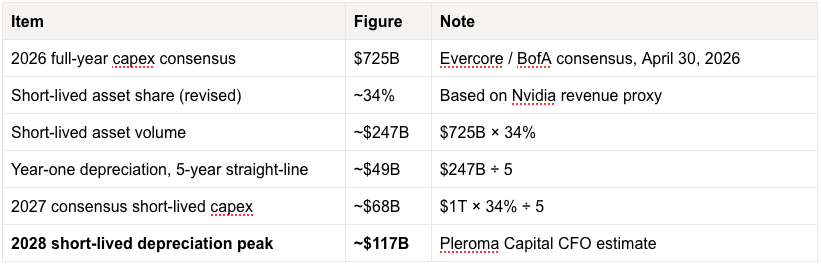
This is substantially below the $260B figure from May 12th. But one thing has not changed: I am still waiting for a single number.
An updated scenario probability distribution is in the model — base case 60%, upside 25%, stress 15%. That distribution will not move until one data point arrives: Q2 hyperscaler earnings backlog conversion rates. I said I was waiting for this on May 12th. I still am.
Behind the paywall: full three-scenario depreciation figures, individual OBBBA tax shield calculations for Amazon, Google, and Microsoft, the two 2028 data points I am watching, and what I intend to do with my position if Q2 backlog conversion rates fall below 50%.
