
CFO Biweekly: 2026/7/1
16.8% Asked to Get Out. 12% Couldn’t. So I Recalculated Every “Semi-Liquid” Position

Apollo gated 12% of redemption requests. The BOJ lifted its policy rate to the highest since 1995. Warsh printed a rate-hike signal in the dot plot, and my bank is repricing my revolving credit lines next week. Every single one of them is back on the table.
These three events didn’t hit three different risks. They hit the same assumption: that the assets you hold can be turned into cash when you need them.
One number made me stop this week.
Apollo announced that its flagship retail private credit fund had received redemption requests equal to 16.8% of net assets, roughly $2.4 billion (CNBC, June 23, 2026). It allowed out 5%.
The other 12% got locked in.
The market’s reaction: the private credit crisis has begun. My reaction: Apollo didn’t fail. It followed the rulebook. The rulebook always said “quarterly redemptions capped at 5%.”
The question isn’t whether Apollo gated redemptions. The question is how many of the people who bought that fund ever actually read that line, and then asked themselves the more basic question. In the exact quarter I actually need the money, what does “semi-liquid” really mean?
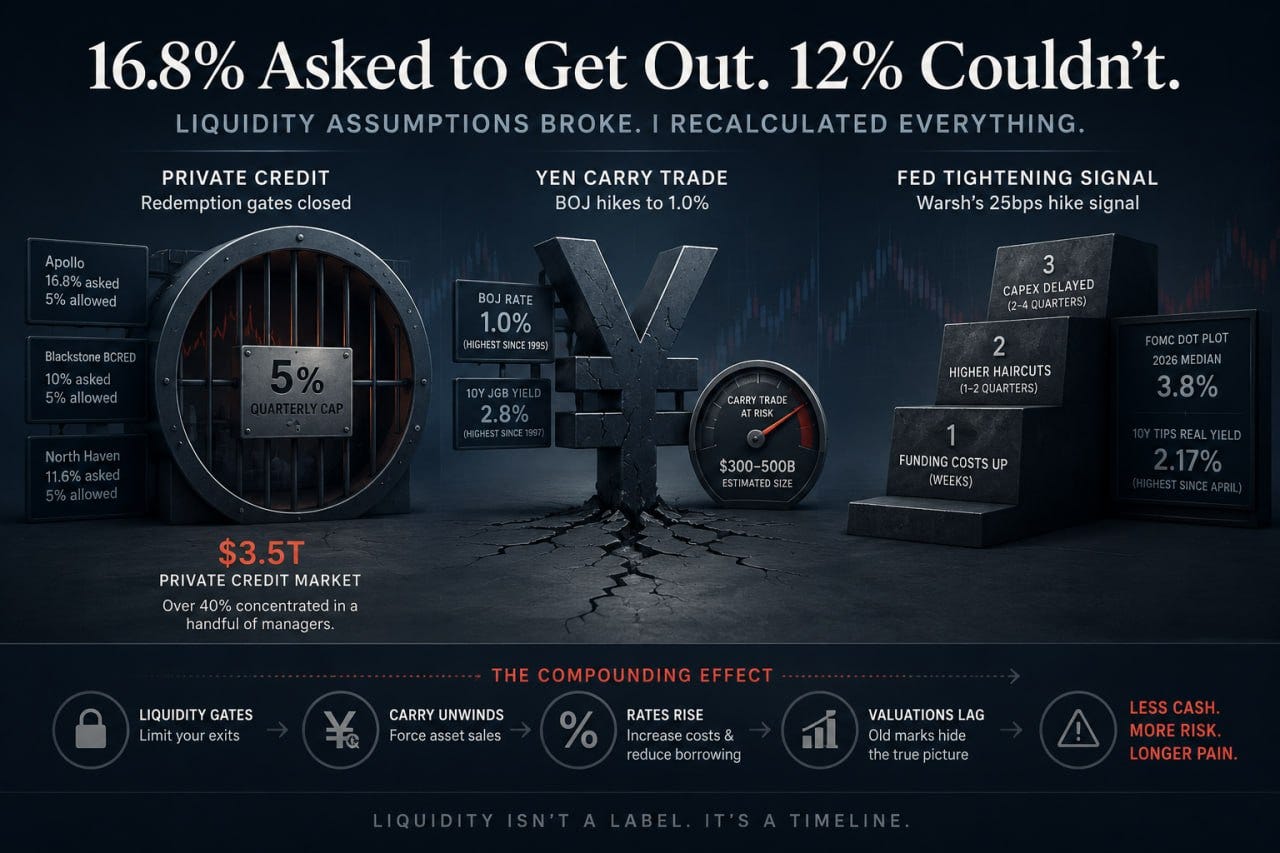
Three traps, one assumption
Private credit, the yen carry trade, and a Fed tightening signal. Three events triggered in the same week, and they all hit the same spot.
Trap one: the $3.5 trillion private credit market closes its redemption gates simultaneously
Blackstone BCRED ($79 billion): investors asked to redeem 10%, got 5% (Bloomberg, June 4, 2026). Morgan Stanley North Haven ($7 billion): asked 11.6%, got 5% (Bloomberg, June 23, 2026). Apollo Debt Solutions (implied size ~$14.3 billion, based on $2.4 billion / 16.8%): asked 16.8%, got 5% (CNBC, June 23, 2026).
Three gates hit in the same month. Three funds at the same 5% cap.
That’s not a coincidence, and it’s not a crisis. It’s a simultaneous stress test by design. But it reveals something: the global private credit market sits at $3.5 trillion (AIMA, 2026), with more than 40% concentrated in a handful of managers. When they all gate together, the liquidity exit narrows. And once it narrows, where does the overflow go? The public high-yield market, where the OAS is currently 283 bps (ICE BofA / FRED, June 26, 2026). That’s near historic lows, partly because money squeezed out of private credit is hunting for substitutes.
The math is simple. If you have $100 million in BCRED, you can take out at most $5 million per quarter. Total exit time: 100% ÷ 5% = 20 quarters = five years. You thought you held a liquid asset. What you actually hold is a five-year lockup dressed up as a fund.
Trap two: BOJ hikes to 1%. An estimated $300–500 billion carry trade starts its countdown.
On June 16, the Bank of Japan voted 7-to-1 to lift its policy rate to 1.0%, the highest since 1995 (BOJ statement, June 16, 2026; CNBC). The 10-year JGB yield hit 2.8%, a level not seen since 1997. Dollar-yen sat at 160.22 after the decision, and has continued to edge higher since.
The carry logic is straightforward: borrow yen (funding cost now 1.0%, up from 0.75%), buy dollar assets yielding 4–5%, pocket the spread. The global carry book is estimated at $300–500 billion (Wellington Management). The BOJ hike doesn’t kill the carry trade outright. It’s the third turn of the screw compressing its yield.
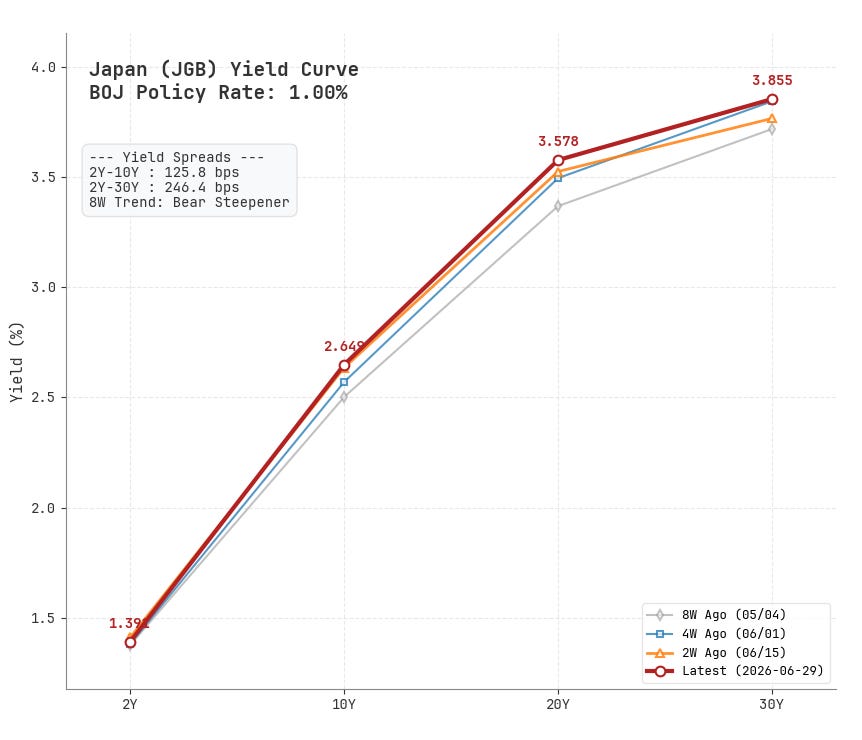
The transmission path: BOJ hikes further, yen strengthens, carry positions go underwater, forced unwinds begin, dollar assets get sold to buy back yen. The first thing sold is always the most liquid. That’s the thing you thought was safest. In August 2024, the BOJ surprised with a hike and that mechanism took the Nasdaq down more than 10% in three trading sessions. That episode was smaller and faster. This one is larger and slower. Slow doesn’t mean benign. It means the pot boils longer.
Trap three: Warsh’s tightening signal. My bank is repricing next week.
The FOMC dot plot showed a median rate of 3.8% for year-end 2026, implying a 25 bps hike (FOMC SEP, June 17, 2026). The 10-year TIPS real yield (DFII10) sits at 2.17%, its highest since April (FRED, June 26, 2026).
For a CFO, that signal travels along three direct paths, ranked by speed.
First, the fastest. Weeks. Funding costs get repriced. The real yield has climbed from 2.04% to 2.17%, a move of 13 bps. The next time I sit down with a bank, the opening quote won’t be the same number it was last time. This isn’t a theoretical discount rate. It’s the interest expense written into the contract.
Second, a little slower. One to two quarters. Haircuts on collateral get revised upward. The bank’s credit department marks down the advance rate on private credit assets. A direct lending fund that used to borrow at 75% LTV now gets 70%. Same assets, less leverage, less cash available. This adjustment runs on a separate track from the mark-to-model valuation of the underlying assets. It happens earlier, and it happens quietly.
Third, the slowest but the biggest. Two to four quarters. Capex thresholds automatically start killing projects. A plant expansion that cleared an 8% IRR against the firm’s 7% hurdle falls below the line once the WACC picks up 25–30 bps. It gets shelved. Nobody needs to call a meeting. The numbers shut the gate on their own.
The underlying assets in private credit funds are mark-to-model, updated once a quarter. Funding costs and haircuts are already moving. The book valuations won’t catch up until September at the earliest. Redemption requests are at their highs, banks are already repricing, and the asset side is still carrying old marks. That window is the ugliest place a private credit investor can find themselves.
When all three traps trigger at once, the pool of assets you can actually turn into cash, fast, is much smaller than you thought. The gap isn’t marginal.
What I did about it
I re-ran the worst-case liquidity timeline for every “semi-liquid” position.
The steps: list every asset I thought I could convert to cash within 90 days. For each one, find the actual redemption terms or liquidity mechanism.
Not what I assumed, but what the documents say. Apply a “5% quarterly cap” as the stress assumption for private credit. Apply “BOJ continues hiking, carry unwind begins” as the stress assumption for public-market liquidity. Then calculate how much cash I can actually get my hands on in 90 days when both stresses hit at once.
The result: I multiplied my original liquidity buffer by 0.6. It didn’t vanish from the balance sheet; it vanished from the usable time window.
I didn’t act immediately. We’re not in the worst-case scenario right now. We’re in its early signals. What I did was lock in the action plan. If Blackstone BCRED announces it’s hitting the 5% cap for a second consecutive quarter, that tells me redemption pressure isn’t easing, and I’ll re-label every “semi-liquid” position from “quarterly redeemable” to “annual redeemable.” If USD/JPY breaks 155, that tells me the carry unwind is accelerating, and I’ll reassess any position with BOJ funding exposure. Both triggers are now in my monitoring list. BCRED and Morgan Stanley North Haven next-quarter redemption numbers are due by late July.
I ran a full liquidity stress-test framework this week. Paid subscribers get:
A three-step liquidity gap calculation. Plug in your own numbers and find your true, stress-adjusted cash availability.
The exact trigger thresholds for all three conditions, plus my action sequence if they hit.
The BOJ carry-unwind asset liquidation sequence. Which assets get sold first, which last, and how to play each time window.
